iQ-DASHBOARD 1.0.2 – Your PACS at a glance!
Our PACS business intelligence solution iQ-DASHBOARD is back in a performance-improved version. PACS administrators are now able to gain an even faster overview of what is happening in their iQ-WEB 6.7.3.
With the help of iQ-DASHBOARD 1.0.2, you can easily find out how many imaging studies were created per device during the last month, which was the most examined body part during the last year, which hospital site is doing the most CT scans, or which referring physician referred the most patients during this year just to name a few examples. This makes iQ-DASHBOARD a great tool for performance reviews – not just for PACS administrators or IT personnel, but also for medical directors, heads of radiology departments or financial officers.
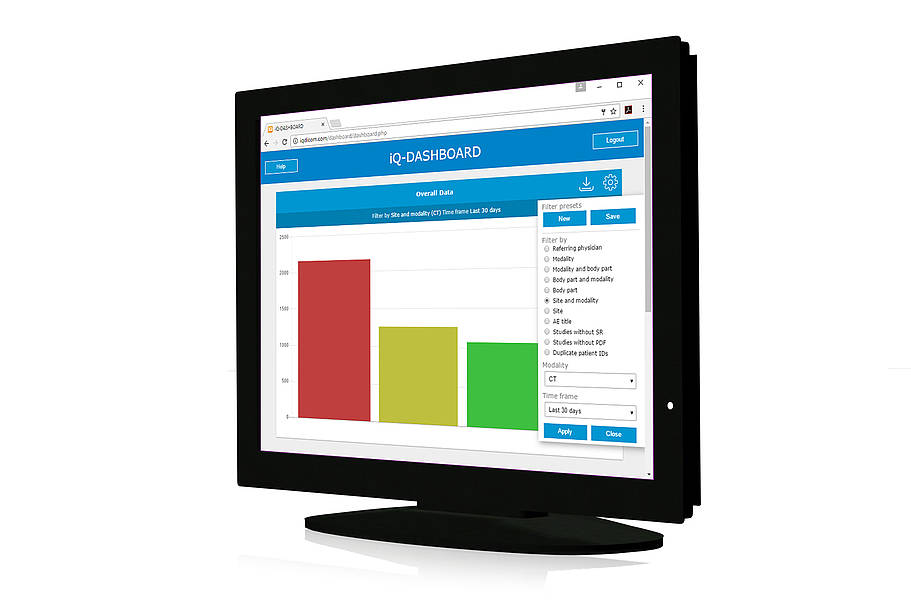
All the information is available at a glance! Simply select the desired filter options and time ranges to let iQ-DASHBOARD present your PACS statistics in a clearly arranged bar chart. Another feature of iQ-DASHBOARD is the “Live Monitor” which lists all incoming studies of the last 30 minutes. All studies show a link to the respective study in the PACS. This way, administrators can immediately detect any technical issues if studies suddenly stop coming in. Also if the administrator is informed by the medical staff that studies do not appear in the PACS or cannot be opened in the viewer, the administrator can check the problem straight away.
To get to know iQ-DASHBOARD yourself, please feel free to try it on our demo server or check out the respective flyer. iQ-DASHBOARD is also available in our Download Center.